
Your view of the market
What is behind the next move?
Discover trends, important price zones and connections. Bring your observations together in an analysis you can follow and understand.
Your view of the market
Discover trends, important price zones and connections. Bring your observations together in an analysis you can follow and understand.
Topic 1 of 6: What is behind the next move?
Charts. Strategies. AI. All in one workspace.
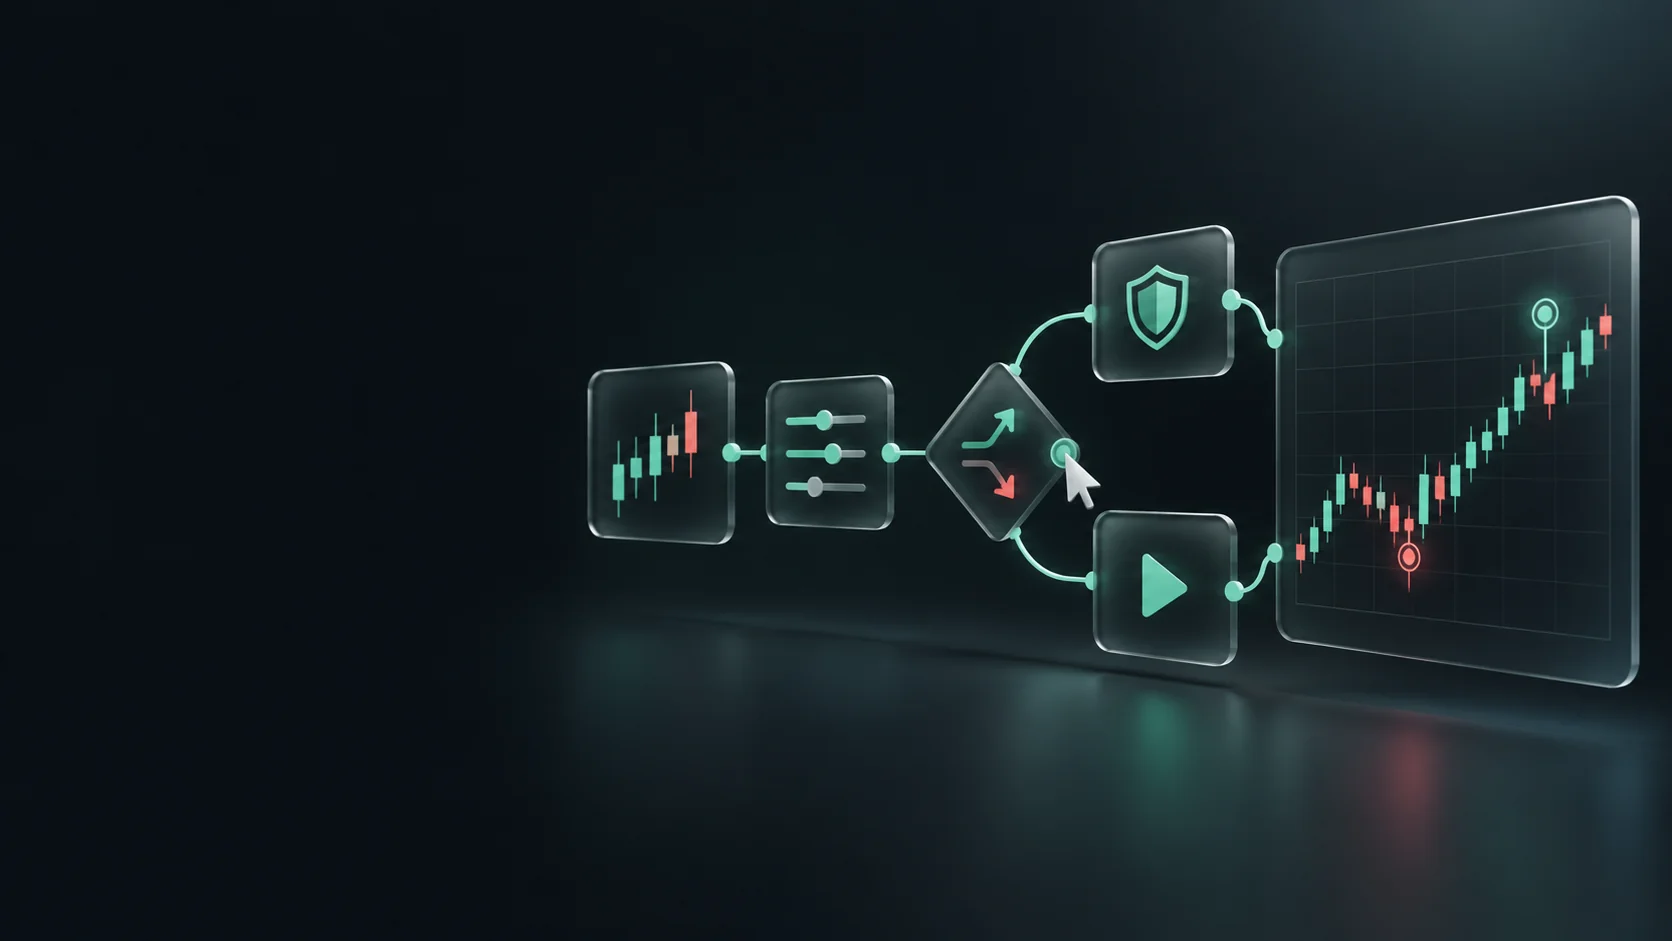
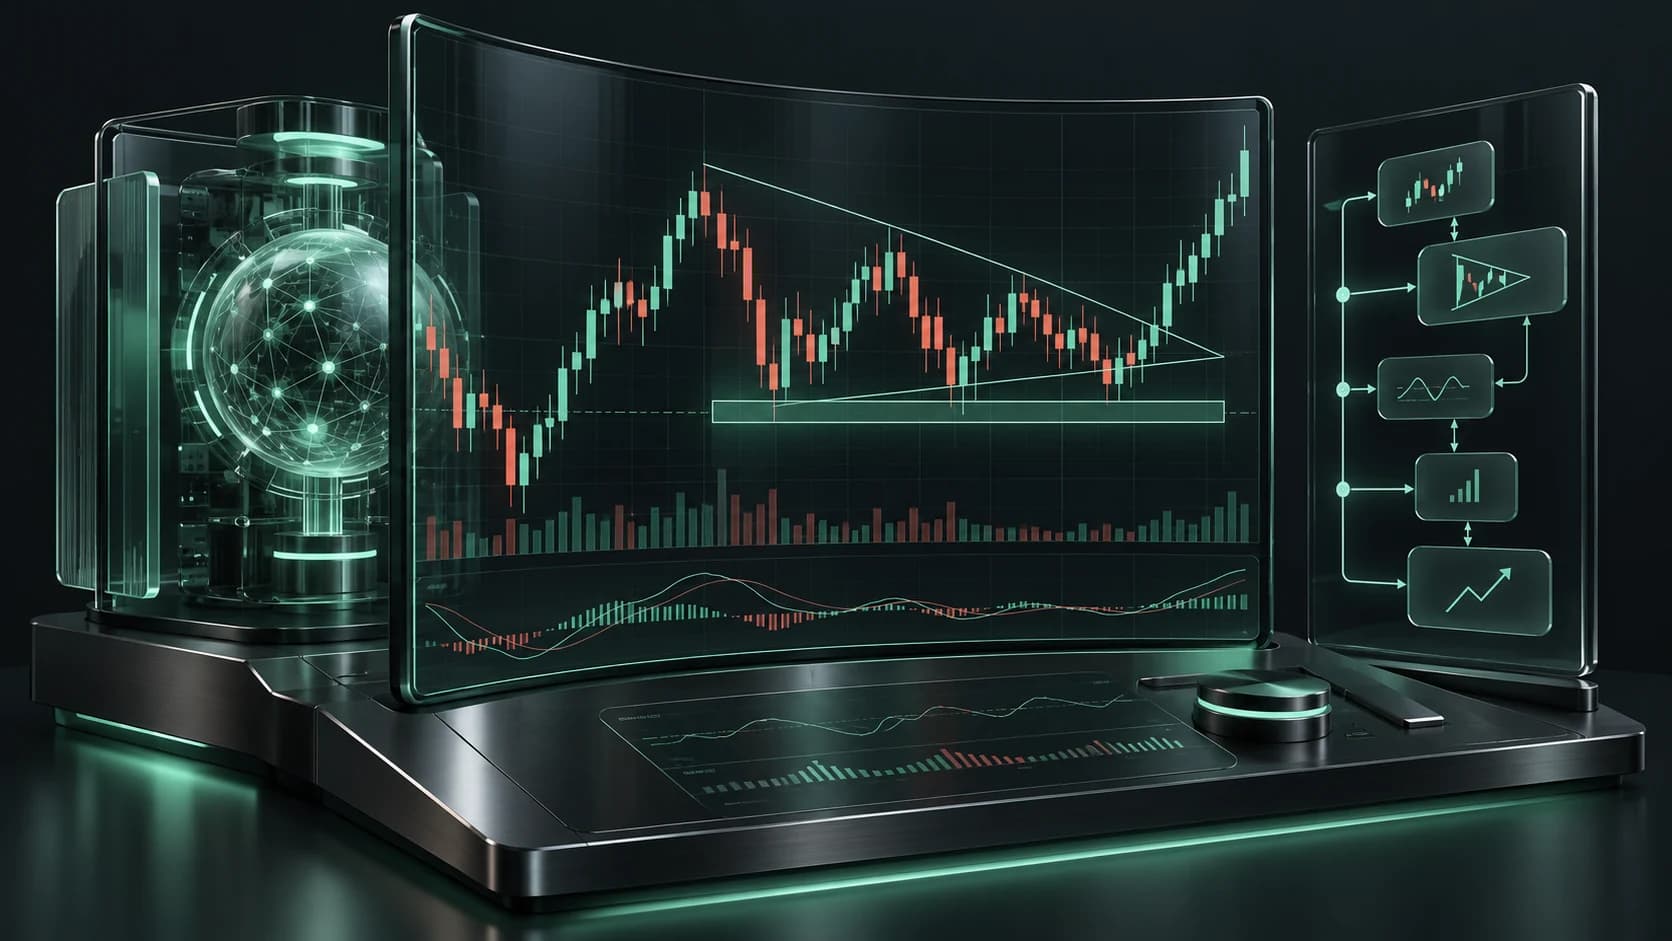
Charts, pattern recognition, indicators and backtesting connect your observations to testable strategy rules. Develop ideas in the visual builder and use the AI analyst with four coaching styles to better understand setups, counterarguments and risks.
Content provider: BiQuote
After market-data permission, public BiQuote widgets including news and the M1 preview connect your browser to BiQuote. Dukascopy in the account app needs the same category. Requests transmit IP and technical data. Provider-internal storage is not fully verified. Our own chart API does not need this permission. The optional Binance crypto-symbol catalogue also requires market-data permission.
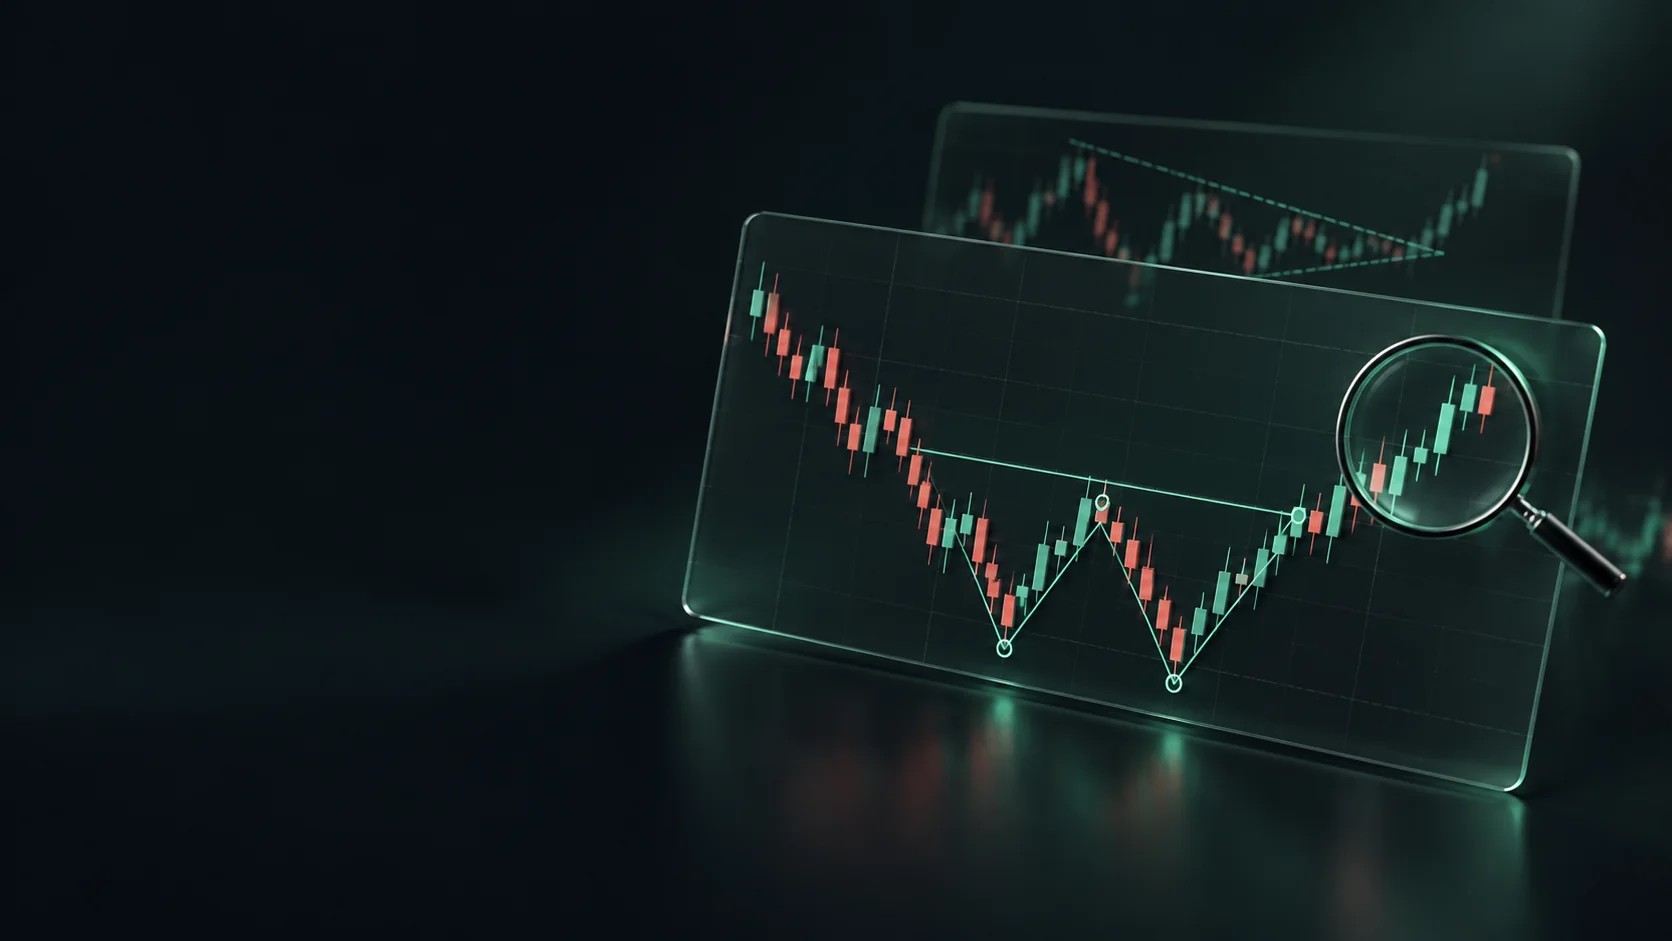
Two highs and a break of the neckline.
Two lows and a break above the neckline.
Three highs with a higher head.
Three lows with a lower head.
Rising lows below resistance.
Long lower wick after a decline.
Long upper wick after a rise.
Bullish body engulfs the previous bearish body.
Bearish body engulfs the previous bullish body.
Open and close are nearly equal.
Fast and slow averages cross.
RSI returns above the lower threshold.
MACD crosses its signal line.
The close returns inside the bands.
The close breaks above previous highs.
Combine available patterns and indicators into your own detection rules and strategies. Adjust conditions, risk and exits, then check them in a backtest.
The AI learns with you and teaches you strategies.